
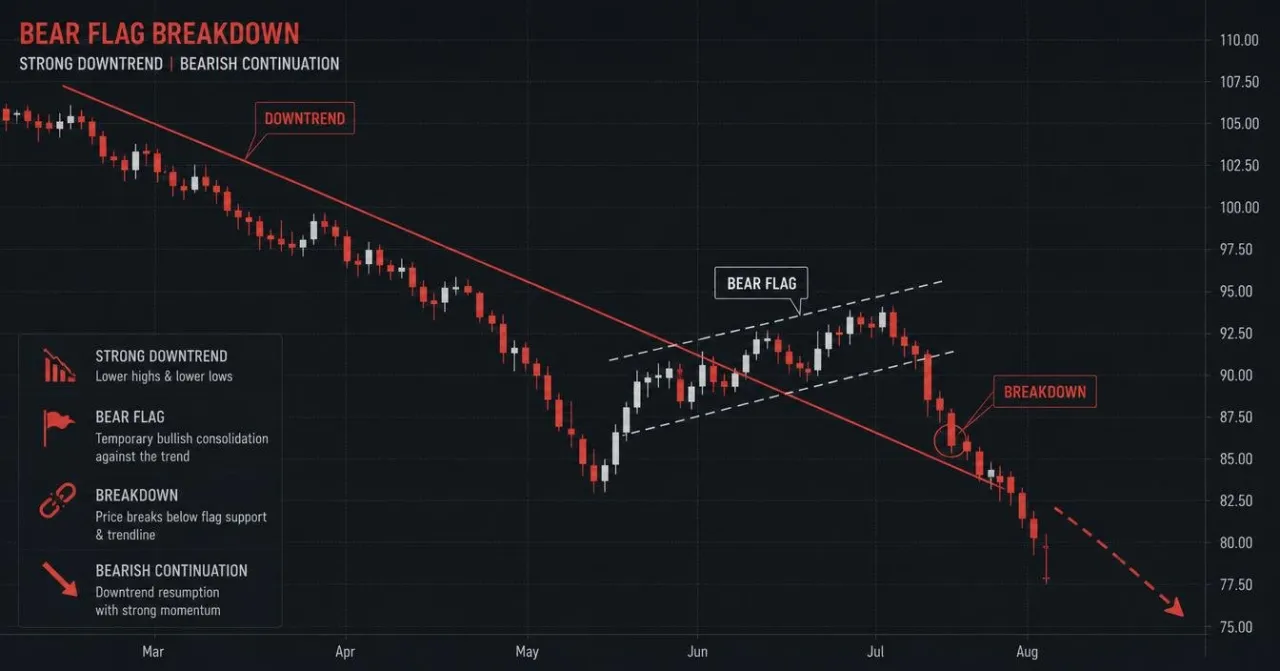
Bitcoin's recent decline to $58,000 has confirmed a bear flag breakdown, a technical pattern that may suggest further downside potential. Traders are now eyeing a possible target of $54,000 or lower, as the market reacts to this bearish setup.
Market Context
The broader market structure indicates that Bitcoin has been under pressure, with recent price action showing a significant drop from previous highs. This decline has activated multiple bearish setups, with market participants closely monitoring the $54,000 level as a potential target.
Key Levels
- Support: $54,000, which could act as a potential target if the bearish momentum continues.
- Resistance: $60,000, a psychological level that Bitcoin needs to reclaim to negate the bearish outlook.
- Critical zones: The area between $58,000 and $60,000 is crucial for determining the next directional move.
Indicators Snapshot
The recent breakdown has been accompanied by bearish signals from key indicators. The Relative Strength Index (RSI) is likely showing oversold conditions, which could suggest a potential for a short-term bounce. Meanwhile, the Moving Average Convergence Divergence (MACD) may be indicating bearish momentum, reinforcing the downward trend.
Scenarios (Next 24–72h)
- Bullish scenario: If Bitcoin reclaims $60,000, it could signal a potential reversal and negate the bear flag breakdown.
- Base case: If Bitcoin consolidates between $58,000 and $60,000, it may indicate indecision, requiring further confirmation for the next move.
- Bearish scenario: If Bitcoin breaks below $58,000 with strong volume, it could target the $54,000 level or lower.
Risk Notes
This analysis is for educational purposes only and does not constitute financial advice. Market conditions can change rapidly. Always conduct your own research and manage risk appropriately.
Comments
Loading comments...